import toml

output_file = "secrets.toml"

with open("serviceAccountKey.json") as json_file:
    json_text = json_file.read()

config = {"textkey": json_text}
toml_config = toml.dumps(config)

with open(output_file, "w") as target:
target.write(toml_config)コア
SCMOPTは様々なシステム(モジュール)を有機的に結合したものである.ここでは,様々なモジュールで使用する共通部品を定義する.
Firebaseの鍵(JSON)をtomlに変換
これをstreamlit/secrets.toml に入れる.
Geocodingのためのデータ
以下から入手可能な全国の町丁目レベル(190,165件)の住所データをもとに緯度・経度の辞書を準備する.
https://github.com/geolonia/japanese-addresses
また,郵便番号データから緯度・経度と住所が得られるような辞書も準備する.
#保存しておく
import pickle
with open('geocode.dump', 'wb') as f:
    pickle.dump(pref_dic, f)
#使うときには以下のように読み込んで使う; 7.3MB
import pickle
with open('../data/geocode.dump', 'rb') as f:
pref_dic = pickle.load(f)
pref_dic["千葉県"]["八千代市"]['勝田台一丁目'](35.713482, 140.125796)郵便番号との紐付け
一部離島は郵便番号はあるが緯度・経度がない.
#使うときには以下のように読み込んで使う 10.8 MB
import pickle
with open('../data/zipcode.dump', 'rb') as f:
    zip_dic = pickle.load(f)
zip_dic[2760049]
[('千葉県', '八千代市', '緑が丘一丁目', 35.730675, 140.076559),
('千葉県', '八千代市', '緑が丘二丁目', 35.725406, 140.071748),
('千葉県', '八千代市', '緑が丘三丁目', 35.727209, 140.07583),
('千葉県', '八千代市', '緑が丘四丁目', 35.727973, 140.077712),
('千葉県', '八千代市', '緑が丘五丁目', 35.730743, 140.081562),
('千葉県', '八千代市', '緑が丘西一丁目', 35.730146, 140.069284),
('千葉県', '八千代市', '緑が丘西二丁目', 35.731764, 140.071975),
('千葉県', '八千代市', '緑が丘西三丁目', 35.736655, 140.071581),
('千葉県', '八千代市', '緑が丘西四丁目', 35.736712, 140.068912),
('千葉県', '八千代市', '緑が丘西五丁目', 35.740159, 140.068172),
('千葉県', '八千代市', '緑が丘西六丁目', 35.743217, 140.069375),
('千葉県', '八千代市', '緑が丘西七丁目', 35.74131, 140.074058),
('千葉県', '八千代市', '緑が丘西八丁目', 35.744167, 140.072585)]GeocodingのためのExcelテンプレート生成
make_excel_geocoding
def make_excel_geocoding(

):
Call self as a function.
wb = make_excel_geocoding()
wb.save("geocoding-templete.xlsx")
#緯度経度変換の使用例
wb = load_workbook("geocoding-templete.xlsx")
ws = wb.active
for i, row in enumerate(ws.iter_rows(min_row=2)):
#inf = zip_dic[int(row[0].value)]
#print(inf) #dropdown list で選択+書き込み
D = pref_dic
for j, cell in enumerate(row[1:]):
#print(j, cell.value)
if cell.value is not None:
try:
D = D[cell.value] #dic
except:
print(D)
#候補を示す
if isinstance(D, tuple):
ws.cell(i+2,6).value = D[0]
ws.cell(i+2,7).value = D[1]
else:
break0 千葉県
1 八千代市
2 緑が丘一丁目
3 Nonewb.save("geocoding-ex1.xlsx")住所文字列を都道府県,市区町村,それ以降に分割する関数 address_split
正規表現を用いる.
address_split
def address_split(
    address:str
):
Call self as a function.
address ="千葉県八千代市緑が丘一丁目"
address_split(address)
['千葉県', '八千代市', '緑が丘一丁目']住所列の文字列を分解する関数 fill_separate_address
fill_separate_address
def fill_separate_address(
    wb
):
Call self as a function.
#df = pd.read_excel("geocoding-ex1.xlsx", sheet_name="住所")
wb = load_workbook("geocoding-ex1.xlsx")
wb = fill_separate_address(wb)
wb.save("geocoding-ex3.xlsx")
日付時刻もしくは時刻型の差を計算して,秒を返す関数 time_delta
引数:
- finish: 終了時刻を表す日付時刻型(もしくは時刻型)
- start: 開始時刻を表す日付時刻型(もしくは時刻型)
返り値:
- 時刻の差(秒)
time_delta
def time_delta(
    finish, start
):
日付時刻もしくは時刻型の差を計算して,秒を返す関数
time_deltaの使用例
print( time_delta( dt.datetime(2020,1,2,10,0), dt.datetime(2020,1,1,0,0)) )
print( time_delta( dt.time(10,0), dt.time(11,0)) )
print( time_delta( dt.time(12,0), dt.time(6,0)) )
122400
-3600
21600日付時刻(もしくは時刻)型に指定した時間(秒)を加えた時刻を返す関数 add_seconds
引数 - start: 開始時刻を表す日付時刻型(もしくは時刻型) - seconds: 時間(秒)
返値: - 指定した時間だけすすめた(日付)時刻
add_seconds
def add_seconds(
    start, seconds
):
Call self as a function.
add_secondsの使用例
print( add_seconds( dt.datetime(2020,1,1,10,0), 1000) )
print( add_seconds( dt.time(10,0), 1000) )
2020-01-01 10:16
10:16ソルバーのエラークラス
SolverError
def SolverError(
    args:VAR_POSITIONAL, kwargs:VAR_KEYWORD
):
ソルバーのエラーのための例外クラス
地点(顧客)間の距離と移動時間の計算関数 compute_durations
OSRMを必要とする.
引数: - cust_df: 顧客データフレーム(名称と緯度・経度情報をもつデータフレーム) - plnt_df: 工場データフレーム(オプション;既定値 None) - toll: 有料道路が使用可のときTrue(既定値 True) - ferry: フェリーが使用可のときTrue(既定値 True) (TODO: OSRMの前処理時に,car.luaファイルを以下を修正する必要がある.)
excludable = Sequence {
        Set {'toll'},
        Set {'motorway'},
        Set {'ferry'},
        Set {'ferry', 'toll'})
},- host: ホスト名;既定値は “localhost”
返値: - durations: 地点間の移動時間(計算に失敗した場合には大きな数字が入っている.) - distances: 地点間の道路距離(計算に失敗した場合には大きな数字が入っている.) - node_df: 点のデータフレーム(顧客もしくは顧客と工場を結合したもの)
compute_durations
def compute_durations(
    cust_df, plnt_df:NoneType=None, toll:bool=True, host:str='localhost'
):
Call self as a function.
compute_durations関数の使用例
#
# cust_df = pd.read_csv(folder+"Cust.csv")
# durations,  distances, node_df = compute_durations(cust_df, toll=True, host="localhost")
# print(durations[0])
cust_df = pd.read_csv(folder+"Cust.csv")
durations, distances, node_df = compute_durations(cust_df, toll=False, host=host)
print(sum(durations[0]))3730084.0地点間の距離と移動時間のデータフレームを生成する関数 make_time_df
引数: - node_df: 点のデータフレーム(顧客もしくは顧客と工場を結合したもの) - durations: 地点間の移動時間(計算に失敗した場合には大きな数字が入っている.) - distances: 地点間の道路距離(計算に失敗した場合には大きな数字が入っている.)
返値: - time_df: 発地,着地,移動時間(秒),道路距離(m)を入れたデータフレーム
make_time_df
def make_time_df(
    node_df, durations, distances
):
Call self as a function.
make_time_df関数の使用例
time_df =  make_time_df(node_df, durations, distances)
time_df.head()
#time_df.to_csv(folder + "melos/time.csv")| from_node | from_name | to_node | to_name | time | distance | |
|---|---|---|---|---|---|---|
| 0 | 0 | 札幌市 | 0 | 札幌市 | 0 | 0 |
| 1 | 0 | 札幌市 | 1 | 青森市 | 23888 | 427015 |
| 2 | 0 | 札幌市 | 2 | 盛岡市 | 28257 | 546453 |
| 3 | 0 | 札幌市 | 3 | 仙台市 | 36161 | 721614 |
| 4 | 0 | 札幌市 | 4 | 秋田市 | 31428 | 610043 |
time_dfからdurationsとdistancesを生成する関数 make_durations
上で作成した time_df から,移動時間と移動距離を生成する.
引数: - time_df: 移動時間と道路距離を保持するデータフレーム
返値: - durations: 移動時間行列 - distances: 道路距離行列
make_durations
def make_durations(
    time_df
):
Call self as a function.
make_durations関数の使用例
time_df = pd.read_csv(folder + "melos/time.csv")
durations, distances = make_durations(time_df)
distances
array([[ 0., 427015., 546453., ..., 2247148., 2288685., 3080358.],
[ 426987., 0., 183876., ..., 1815653., 1857189., 2648863.],
[ 546501., 183838., 0., ..., 1736609., 1778145., 2569819.],
...,
[2247483., 1814532., 1736893., ..., 0., 132654., 924327.],
[2293427., 1860476., 1782837., ..., 134850., 0., 795782.],
[3083057., 2650105., 2572466., ..., 924479., 795964., 0.]])seabornのカラーパレットと色数を指定すると、Plotly用のカラーパレットを返す関数 get_colorpalette
seabornのカラーパレットと色数を指定すると、Plotly用のカラーパレットを返す.
使用できるseabornのパレット名は,以下の通り.
deep, muted, bright, pastel, dark, colorblindget_colorpalette
def get_colorpalette(
    colorpalette:str='pastel', n_colors:int=1
):
Call self as a function.
get_colorpalette関数の使用例
n_legends = 12
x = np.arange(0, 1, .01)
y = np.random.rand(n_legends, 100) + \
  np.arange(n_legends).reshape(-1, 1)

colors = get_colorpalette('pastel', n_legends)
data = [
    go.Scatter(
        x=x, y=y[i], name=f'Legend {i}',
        marker={'color':colors[i]})
    for i in range(n_legends)]
fig = go.Figure(data=data)
#plotly.offline.plot(fig);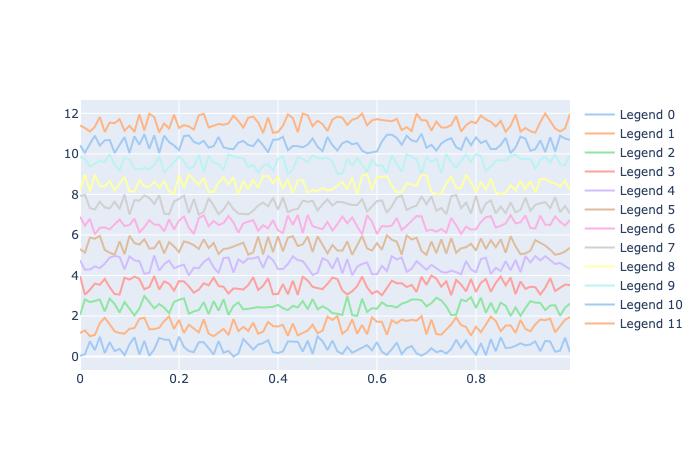
グラフクラス SCMGraph
サプライ・チェインのためのグラフクラス
SCMGraphクラスは,networkXの有向グラフクラスDiGraphから派生したものであり,以下のメソッドが追加されている.
- random_directed_tree(n=1, seed=None): ランダムな有向木を生成する.引数は点数n(既定値1)と擬似乱数の種seed(既定値None).
- layered_network(num_in_layer=None, p=0.5, seed=None): ランダムな層型の有向グラフを生成する. 引数num_in_layerは,各層内の点数を入れたリストで既定値は[1,1],pは枝の発生確率で既定値は0.5,seedは擬似乱数の種である.
- layout(): 有向グラフを描画する際の座標を返す関数.返値は点の名称をキーとし,点のx,y座標を値とした辞書.
- down_order(): 閉路を含まない有向グラフに対して,供給地点側から需要地点側の順番で点を返すジェネレータ関数.
- up_order(): 閉路を含まない有向グラフに対して,需要地点側から供給地点側の順番で点を返すジェネレータ関数.
- dp_order(): 有向木に対して,葉から順番に点を生成するジェネレータ関数. 安全在庫配置問題に対する動的最適化で用いる.
- bfs(start): 点startを開始点として,広がり優先探索で点を生成するジェネレータ関数.
- find_ancestors(): 各点から到達可能な点の集合(自分自身を含む)を保持するリスト.点の順序はup_orderとする.
/Users/mikiokubo/Documents/dev/manual/.venv/lib/python3.13/site-packages/fastcore/docscrape.py:259: UserWarning: Unknown section See Also
else: warn(msg)SCMGraph
def SCMGraph(
    incoming_graph_data:NoneType=None, # Data to initialize graph.  If None (default) an empty
graph is created.  The data can be an edge list, or any
NetworkX graph object.  If the corresponding optional Python
packages are installed the data can also be a 2D NumPy array, a
SciPy sparse array, or a PyGraphviz graph.
    attr:VAR_KEYWORD, # Attributes to add to graph as key=value pairs.
):
SCMGraph is a class of directed graph with edge weight that can be any object. I just use the functions such as in_degree, out_degree, successors, predecessors, in_edges_iter, out_edges_iter. So it is convertible to any graph class that can access the adjacent nodes more quickly.
SCMGraphの使用例
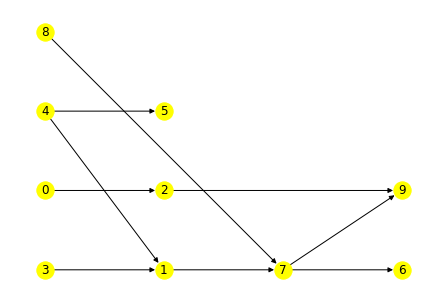
階層型ネットワークを生成し,点の座標(レイアウト)を計算して描画する.
G = SCMGraph()
G.layered_network(num_in_layer=[3, 2, 3], p=0.4, seed=123)
pos = G.layout()
nx.draw(G, pos=pos, with_labels=True, node_color="Yellow")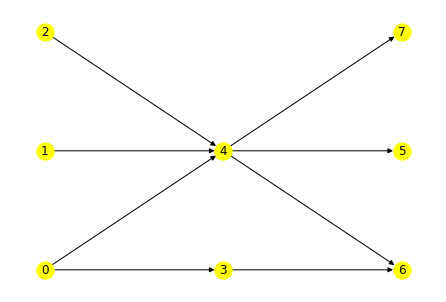
print("up order")
for i in G.up_order():
    print(i, end=" ")
up order
7 6 3 5 4 2 1 0 print("down order")
for i in G.down_order():
print(i, end=" ")down order
2 1 0 4 7 5 3 6 print("dp order")
for i in G.dp_order():
print(i, end=" ")
G.remove_edge(0, 3)
for i in G.dp_order():
print(i, end=" ")dp order
Graph is not a tree.
0 1 2 3 5 6 7 4 print("bfs")
for i in G.bfs(1):
print(i, end=" ")bfs
1 4 5 6 7 print("ancestor")
G.find_ancestors()ancestor{0: {0, 4, 5, 6, 7},
1: {1, 4, 5, 6, 7},
2: {2, 4, 5, 6, 7},
3: {3, 6},
4: {4, 5, 6, 7},
5: {5},
6: {6},
7: {7}}pos{0: (0, 0),
1: (0, 1),
2: (0, 2),
3: (1, 0),
4: (1, 1),
6: (2, 0),
5: (2, 1),
7: (2, 2)}#Pyvisを利用して描画(メソッドにする)
net = pyvis.network.Network(height='500px', width='800px', directed = True, notebook = True,
bgcolor='#ffffff', font_color=False, layout=True, heading='Sample')
level =[]
pos = G.layout()
for i in pos:
x,y = pos[i]
level.append(x)
for i in G.nodes():
net.add_node(i, label=f"node{i}", level=level[i], shape="box", color="yellow")
#net.add_node(i, label=f"node{i}", x=pos[i][1], y=pos[i][0], shape="box", color="yellow")
for (i,j) in G.edges():
net.add_edge(i,j, value=i*j, title=f"Edge{i},{j}",color="green", dashes=False, selectionWidth=10, arrowStrikethrough=False)
net.show("example.html")random_directed_tree関数
ランダムな有向木を生成する。
引数: 点数 n
返値: 点数 n のランダムな有向木
G = SCMGraph()
G.random_directed_tree(10, seed=1)
pos = G.layout()
nx.draw(G, pos=pos, with_labels=True, node_color="Yellow")